
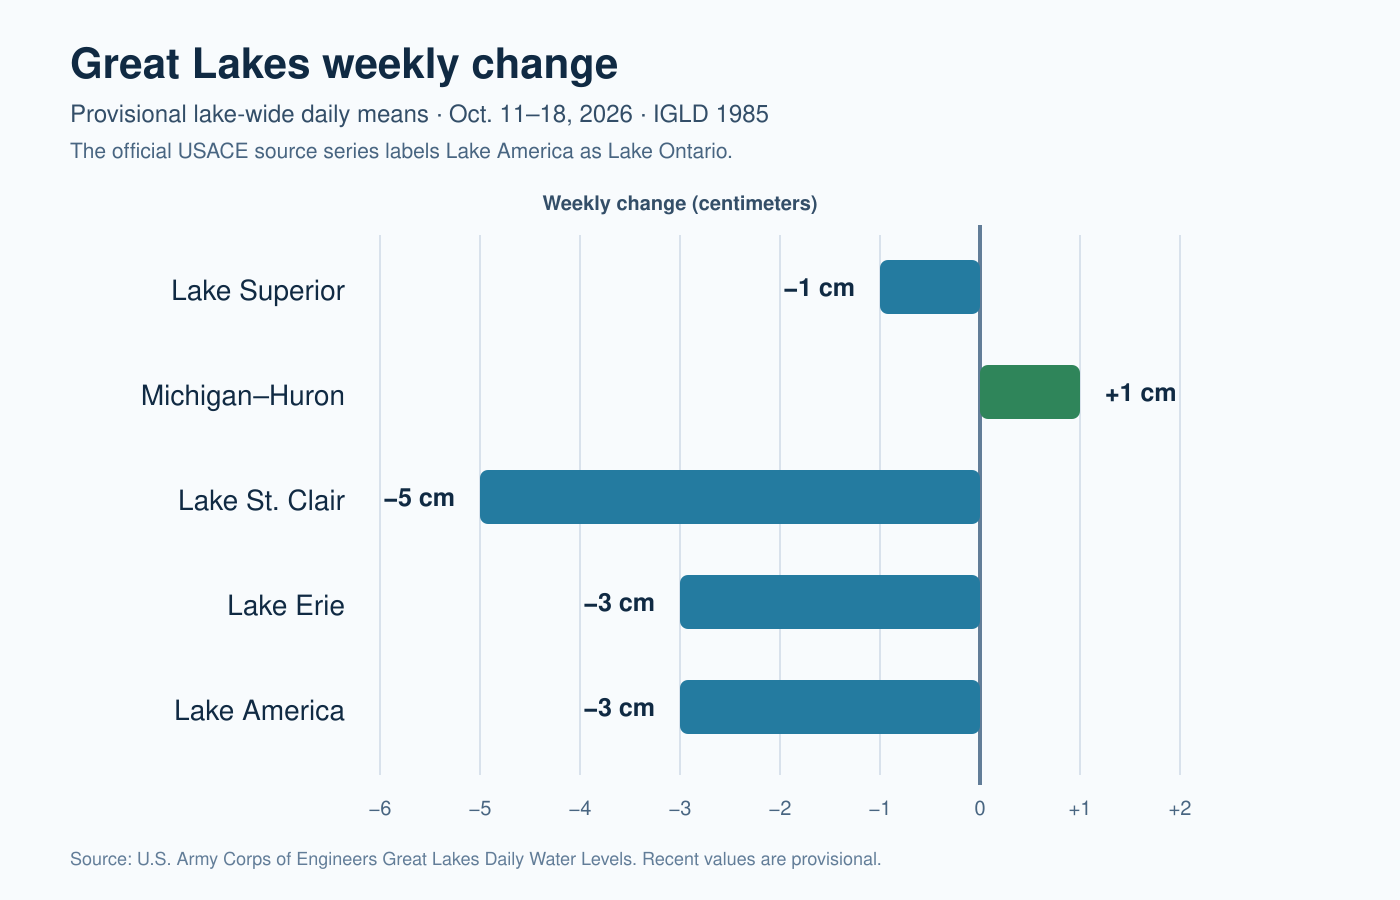
Lake St. Clair recorded the largest lake-wide change during the week ending October 18, 2026, declining 5 centimeters (about 2.0 inches). Lake Erie and Lake America (Lake Ontario) each fell 3 centimeters, Lake Superior edged down 1 centimeter, and Michigan–Huron rose 1 centimeter.

Lake-by-lake weekly change
| Lake system | Oct. 11 | Oct. 18 | Weekly change |
|---|---|---|---|
| Lake Superior | 183.42 m / 601.77 ft | 183.41 m / 601.74 ft | −1 cm / −0.4 in |
| Michigan–Huron | 176.44 m / 578.87 ft | 176.45 m / 578.90 ft | +1 cm / +0.4 in |
| Lake St. Clair | 175.19 m / 574.77 ft | 175.14 m / 574.61 ft | −5 cm / −2.0 in |
| Lake Erie | 174.25 m / 571.69 ft | 174.22 m / 571.59 ft | −3 cm / −1.2 in |
| Lake America | 74.85 m / 245.57 ft | 74.82 m / 245.47 ft | −3 cm / −1.2 in |
These are provisional lake-wide daily means from the U.S. Army Corps of Engineers, referenced to IGLD 1985. They are not individual shoreline-gauge readings or navigation depths.
What changed from the previous week
The broad decline eased compared with October 4–11. During that earlier week, Superior fell 3 centimeters, Michigan–Huron fell 4 centimeters, St. Clair fell 7 centimeters, Erie fell 3 centimeters, and Lake America fell 7 centimeters. In the latest period, Michigan–Huron reversed to a small 1-centimeter rise; the declines on Superior, St. Clair, and Lake America were smaller; and Erie’s 3-centimeter decline matched the prior week.
Endpoint comparisons show net direction, not a smooth path. Wind setup, seiches, precipitation, evaporation, inflows, outflows, regulation, and the timing of station data can all affect provisional daily lake-wide means.
Seasonal and long-term context
Compared with coordinated October long-term averages, the October 18 daily snapshot was about 3 centimeters above average on Superior, 1 centimeter below average on Michigan–Huron, 11 centimeters above average on St. Clair, 12 centimeters above average on Erie, and 20 centimeters above average on Lake America.
This is a daily observation compared with a monthly historical average, so it is orientation rather than a completed October monthly-mean comparison. Broadly flat-to-lower movement remains consistent with the normal autumn drawdown, but short weekly changes do not determine the rest of the season. The October monthly outlook provides the coordinated six-month forecast and fuller historical comparisons.
Practical shoreline and boating implications
- Lake St. Clair: A 5-centimeter lake-wide decline can become noticeable at shallow approaches, fixed docks, and marginal ramps, though local wind effects may be larger over hours.
- Erie and Lake America: A 3-centimeter decline modestly reduces broad water depth; check local gauges and on-site conditions where clearance is limited.
- Superior and Michigan–Huron: Net movement was only 1 centimeter, too small by itself to imply a meaningful change in ordinary access conditions.
- Navigation: Lake-wide means are not channel soundings. Use current charts, local gauges, depth sounders, marine forecasts, and official notices.
Official sources and current pages
- USACE Great Lakes Daily Water Levels
- USACE Great Lakes water-level data and coordinated statistics
- NOAA GLERL long-term water-level dashboard
Current Great Lakes water levels · Superior · Michigan–Huron · St. Clair · Erie · Lake America
Published October 19, 2026. Recent figures are provisional and may be revised. This report does not replace marine forecasts, official navigation charts, or local emergency guidance.


Leave a Reply