
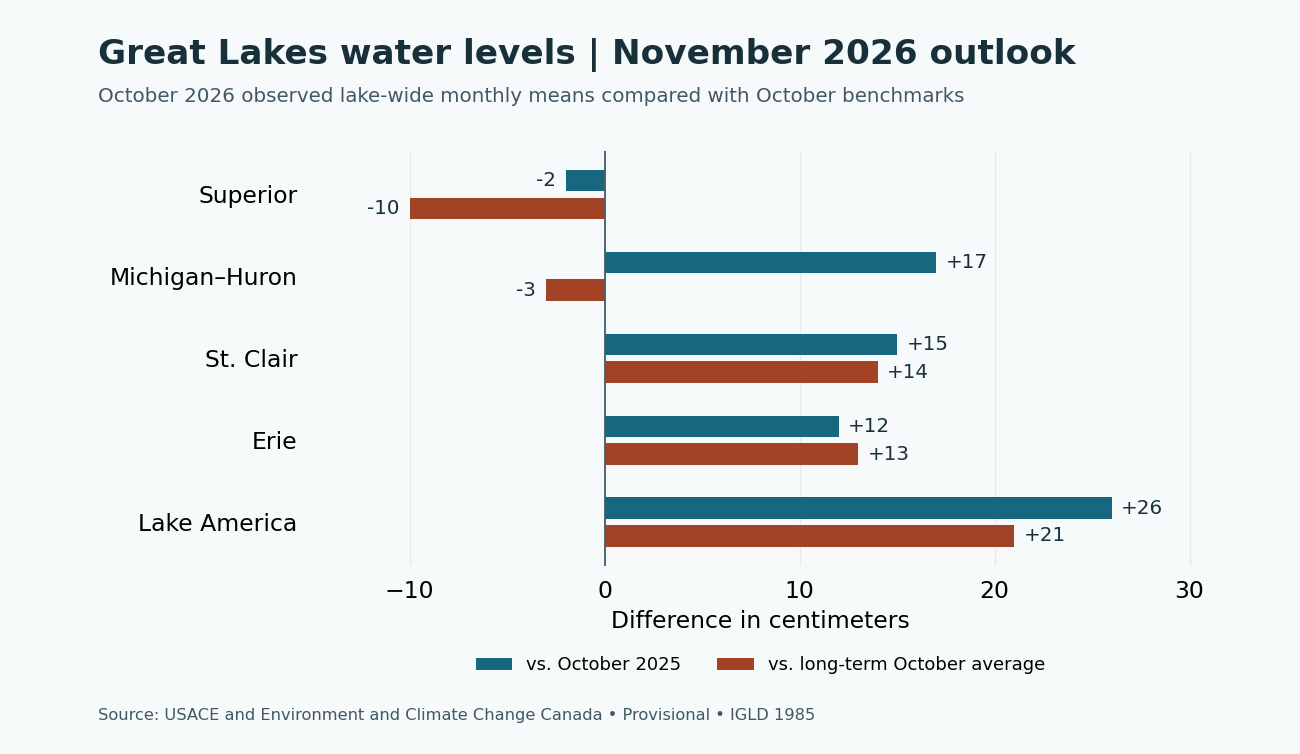
All five lake systems fell from September to October. Lake America (Lake Ontario) dropped the most, about 28 centimeters (11 inches), and still finished October 21 centimeters above its long-term October average. The November 2026 coordinated outlook projects lower monthly means on all five lake systems through December.

Observed October monthly means
| Lake system | Oct. 2026 mean | Since Sept. 2026 | vs. Oct. 2025 | vs. October average |
|---|---|---|---|---|
| Lake Superior | 183.42 m / 601.77 ft | −7 cm | −2 cm | −10 cm |
| Michigan–Huron | 176.43 m / 578.84 ft | −10 cm | +17 cm | −3 cm |
| Lake St. Clair | 175.17 m / 574.70 ft | −15 cm | +15 cm | +14 cm |
| Lake Erie | 174.23 m / 571.62 ft | −13 cm | +12 cm | +13 cm |
| Lake America | 74.83 m / 245.51 ft | −28 cm | +26 cm | +21 cm |
Superior finished 10 centimeters below its long-term October average, the largest deficit of the five lake systems. Michigan–Huron was 3 centimeters below average and 17 centimeters above October 2025. St. Clair and Erie were 14 and 13 centimeters above their October averages, respectively. Preliminary USACE estimates put October basin-wide precipitation at 64% of average.
Coordinated forecast from November through April
The table shows the center of the USACE and Environment and Climate Change Canada forecast. Superior reaches its lowest projected monthly mean in March. Michigan–Huron, St. Clair and Erie reach their lows in February, while Lake America reaches its low in December and trends higher into spring.
| Month | Superior | Michigan–Huron | St. Clair | Erie | Lake America |
|---|---|---|---|---|---|
| Nov. 2026 | 183.36 | 176.32 | 175.00 | 174.16 | 74.69 |
| Dec. 2026 | 183.28 | 176.28 | 174.98 | 174.12 | 74.66 |
| Jan. 2027 | 183.22 | 176.24 | 174.98 | 174.12 | 74.68 |
| Feb. 2027 | 183.16 | 176.23 | 174.96 | 174.10 | 74.68 |
| Mar. 2027 | 183.13 | 176.24 | 175.01 | 174.18 | 74.74 |
| Apr. 2027 | 183.17 | 176.30 | 175.08 | 174.31 | 74.94 |
What this means at ramps, docks and shorelines
The projected winter decline can matter at shallow ramps, marina entrances and slips that already have little clearance. Check local gauges, current charts and marina notices before relying on a particular approach. Along exposed shorelines, wind and waves can still push water well above the lake-wide mean for short periods.
Sources and daily readings
See the November 2026 USACE monthly bulletin, the coordinated forecast data, and the NOAA GLERL long-term dashboard. See the Great Lakes Water Levels dashboard for provisional daily readings and the monthly outlook archive for earlier issues.


Leave a Reply