
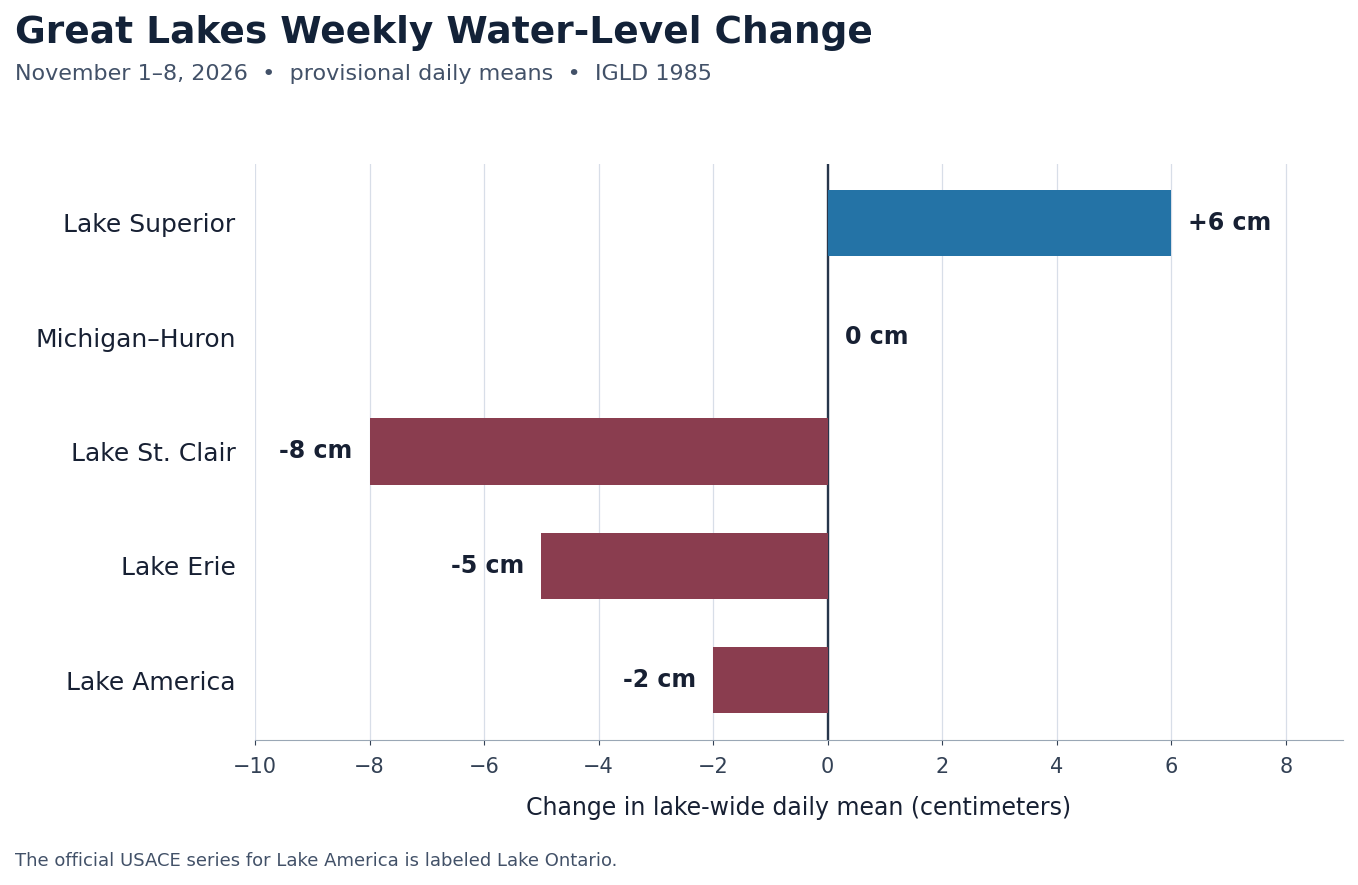
From November 1 to November 8, lake-wide levels rose on Superior, held steady on Michigan–Huron, and declined on St. Clair, Erie, and Lake America (Lake Ontario). The largest weekly move was an 8-centimeter drop on St. Clair. These provisional USACE daily means are referenced to IGLD 1985.

November 1 and November 8 daily means
| Lake system | Nov. 1 | Nov. 8 | Weekly change |
|---|---|---|---|
| Lake Superior | 183.39 m / 601.67 ft | 183.45 m / 601.87 ft | +0.06 m / +0.20 ft (+6 cm) |
| Michigan–Huron | 176.36 m / 578.61 ft | 176.36 m / 578.61 ft | 0.00 m / 0.00 ft (unchanged) |
| Lake St. Clair | 175.10 m / 574.48 ft | 175.02 m / 574.21 ft | −0.08 m / −0.26 ft (−8 cm) |
| Lake Erie | 174.19 m / 571.49 ft | 174.14 m / 571.33 ft | −0.05 m / −0.16 ft (−5 cm) |
| Lake America | 74.72 m / 245.14 ft | 74.70 m / 245.08 ft | −0.02 m / −0.06 ft (−2 cm) |
Compared with the October 25–November 1 report, Superior reversed from a 1-centimeter decline to a 6-centimeter rise. Michigan–Huron was unchanged after falling 4 centimeters the previous week. The Lake America decline eased from 5 to 2 centimeters, while St. Clair and Erie fell more than in the prior report.
Seasonal and forecast context
November’s coordinated USACE/Environment and Climate Change Canada outlook centers on monthly means of 183.38 m for Superior, 176.38 m for Michigan–Huron, 175.02 m for St. Clair, 174.15 m for Erie, and 74.74 m for Lake America. The November 8 daily means sit near those centers, but a single day is not a monthly average or a forecast verification. The coordinated forecast includes a range because weather can shift actual levels around the center estimate.
The latest completed monthly comparison is October 2026: the coordinated means were 10 cm below the long-term October average on Superior and 3 cm below on Michigan–Huron, while St. Clair was 14 cm above, Erie 13 cm above, and Lake America 21 cm above. Those monthly comparisons provide broader context than a seven-day change.
Practical shoreline and boating context
The weekly declines on St. Clair, Erie, and Lake America may slightly reduce clearance at shallow ramps, slips, or nearshore approaches where depth is already limited. The changes are small at the lake-wide scale, and local water can move much more over short periods because of wind setup, waves, seiches, and harbor geometry. Lake-wide means are not dock depths or navigation depths; check local gauges, current charts, marina notices, and marine forecasts before a trip.
Sources and Great Lakes Water Watch pages
- USACE Great Lakes Daily Water Levels — primary published daily lake-wide means.
- USACE CWMS Data API — daily series; the official series name remains OntarioLake.Stage.Ave.1Day.1Day.gpl-ccp.
- USACE November 2026 monthly bulletin and coordinated six-month forecast values.
- NOAA GLERL long-term water-level dashboard.
- Great Lakes Water Watch hub.
View the current daily means for Lake Superior, Michigan–Huron, Lake St. Clair, Lake Erie, and Lake America.
All recent figures are provisional and referenced to IGLD 1985. Daily series and source materials may be revised. The USACE CWMS series still labels Lake America as Lake Ontario; the site preserves that official source label.


Leave a Reply