
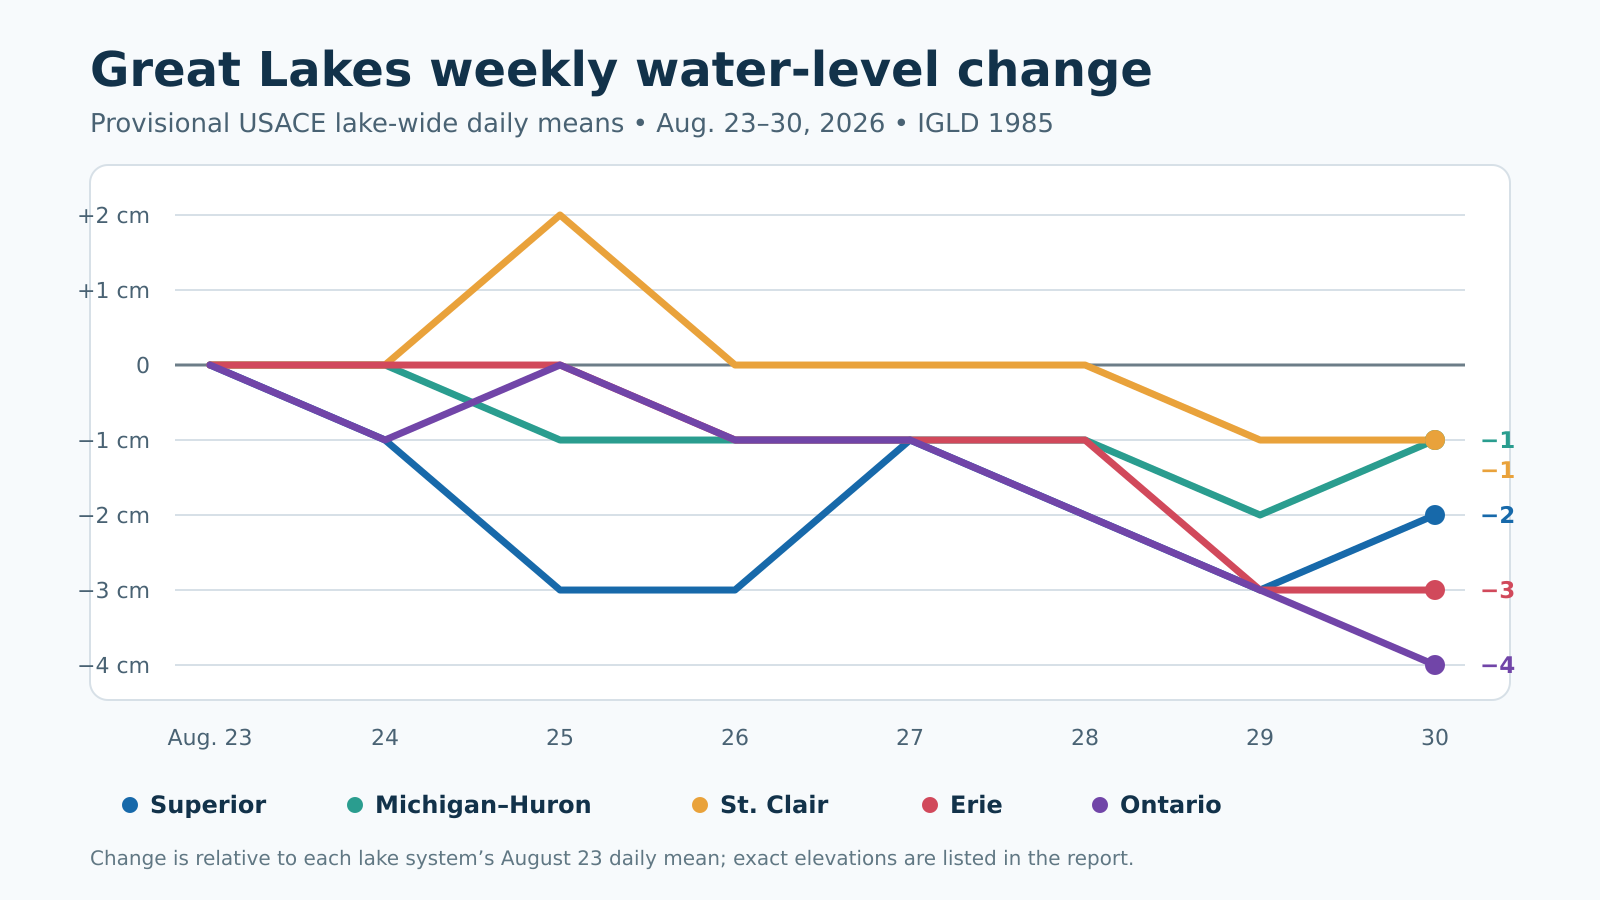
All five Great Lakes lake systems finished lower during August 23–30, 2026. Lake America (Lake Ontario) recorded the largest lake-wide decline at 4 centimeters, followed by Lake Erie at 3 centimeters. Superior fell 2 centimeters, while Michigan–Huron and Lake St. Clair each declined 1 centimeter. These are provisional U.S. Army Corps of Engineers lake-wide daily means referenced to IGLD 1985—not readings from a single shoreline gauge. This report keeps Lake Ontario references where they match historical, Canadian, international, or source terminology.

Great Lakes weekly change at a glance
| Lake system | Aug. 23 daily mean | Aug. 30 daily mean | Weekly change |
|---|---|---|---|
| Lake Superior | 183.53 m / 602.13 ft | 183.51 m / 602.07 ft | −2 cm / −0.8 in |
| Michigan–Huron | 176.58 m / 579.33 ft | 176.57 m / 579.30 ft | −1 cm / −0.4 in |
| Lake St. Clair | 175.32 m / 575.20 ft | 175.31 m / 575.16 ft | −1 cm / −0.4 in |
| Lake Erie | 174.39 m / 572.15 ft | 174.36 m / 572.05 ft | −3 cm / −1.2 in |
| Lake Ontario | 75.24 m / 246.85 ft | 75.20 m / 246.72 ft | −4 cm / −1.6 in |
What changed lake by lake
Superior fluctuated but ended slightly lower
Lake Superior began at 183.53 meters, dipped to 183.50 meters twice during the week, and finished at 183.51 meters. The 2-centimeter net decline is small, and the midweek movement shows why a single daily value should not be treated as a durable trend.
Michigan–Huron and St. Clair were nearly steady
Michigan–Huron ended just 1 centimeter below its August 23 mean after staying within a narrow 2-centimeter range. Lake St. Clair briefly rose 2 centimeters above its starting point on August 25, then finished 1 centimeter lower. Both changes are useful for tracking direction but modest for most practical decisions.
Erie declined more clearly late in the week
Lake Erie held near 174.39 meters early in the period, then declined to 174.36 meters by August 29 and remained there on August 30. Its 3-centimeter—or about 1.2-inch—weekly decrease was the second-largest among the five systems.
Ontario recorded the largest decline
Lake Ontario moved from 75.24 to 75.20 meters, a net decrease of 4 centimeters or about 1.6 inches. It finished at the week’s low, making Ontario the clearest example of late-August downward movement in this report.
Seasonal and forecast context
The latest available USACE one-month update is dated August 14, 2026. It projected that by September 14, Superior would remain near its then-current level, while Michigan–Huron, St. Clair, Erie, and Ontario would decline approximately 2, 3, 4, and 8 inches, respectively. This week’s movement is directionally consistent with that outlook, especially on Erie and Ontario, but one week of provisional observations does not confirm the entire forecast.
That August 14 update also placed Superior 2 inches below its long-term August average, while Michigan–Huron was 1 inch above, St. Clair and Erie were each 5 inches above, and Ontario was 16 inches above. Those are dated forecast-table comparisons—not August 30 monthly means. NOAA GLERL’s long-term dashboard remains the appropriate resource for viewing the broader seasonal cycle and coordinated historical record.
Practical implications for boaters and shorelines
- Shallow approaches: A weekly loss of 1–2 inches is usually manageable, but repeated declines can gradually reduce clearance at shallow ramps, slips, and harbor entrances.
- Fixed docks: Ontario’s 1.6-inch weekly decline may be noticeable at fixed docks, although wind and seiche effects can temporarily be much larger.
- Local readings: Lake-wide means smooth conditions across each lake. Wind setup, waves, seiches, and harbor geometry can produce substantially different local levels.
- Navigation: These elevations are not charted water depths. Use official charts, local gauges, marine forecasts, and notices to mariners for operational decisions.
- Shoreline exposure: Gradual declines can expose more beach or wetland edge, but short-term erosion and flooding risks remain driven mainly by waves, wind direction, and storm duration.
Official sources and current pages
- USACE Great Lakes Daily Water Levels
- USACE One-Month Forecast update dated August 14, 2026
- NOAA GLERL long-term water-level dashboard
- Current Great Lakes Water Watch hub
- Earlier weekly reports
- Great Lakes monthly outlooks
Data status: provisional. All elevations are referenced to IGLD 1985. This report compares lake-wide daily means and should not replace local observations, navigation information, or emergency guidance.


Leave a Reply