
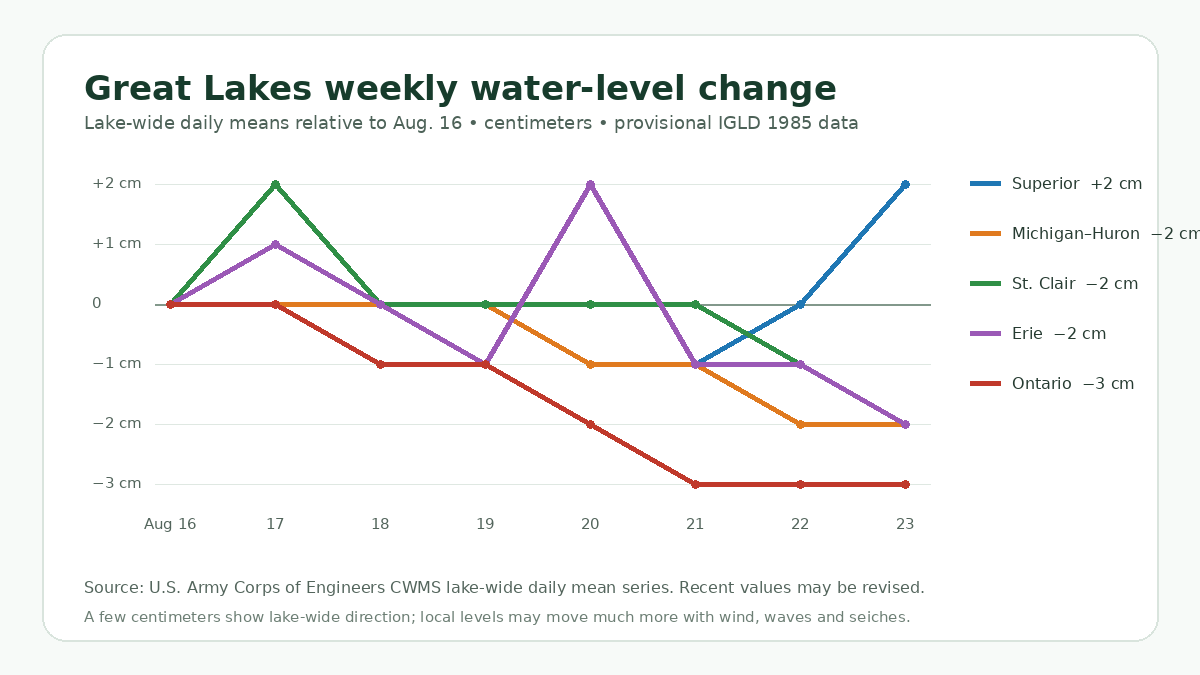
The Great Lakes ended the week of August 16–23, 2026 with small but measurable lake-wide changes. Lake Superior rose 2 centimeters, while Michigan–Huron, Lake St. Clair, and Lake Erie each fell 2 centimeters. Lake America (Lake Ontario) recorded the largest decline at 3 centimeters. These are provisional U.S. Army Corps of Engineers lake-wide daily means referenced to IGLD 1985—not readings from a single shoreline gauge. This report keeps Lake Ontario references where they match historical, Canadian, international, or source terminology.

Great Lakes weekly change at a glance
| Lake system | Aug. 16 daily mean | Aug. 23 daily mean | Weekly change |
|---|---|---|---|
| Lake Superior | 183.51 m / 602.07 ft | 183.53 m / 602.13 ft | +2 cm / +0.8 in |
| Michigan–Huron | 176.60 m / 579.40 ft | 176.58 m / 579.33 ft | −2 cm / −0.8 in |
| Lake St. Clair | 175.34 m / 575.26 ft | 175.32 m / 575.20 ft | −2 cm / −0.8 in |
| Lake Erie | 174.41 m / 572.21 ft | 174.39 m / 572.15 ft | −2 cm / −0.8 in |
| Lake Ontario | 75.27 m / 246.95 ft | 75.24 m / 246.85 ft | −3 cm / −1.2 in |
What changed lake by lake
Lake Superior moved slightly higher
Superior was the only lake system to finish above its August 16 level. It held near 183.51 meters for much of the week, dipped by about a centimeter on August 20 and 21, then recovered to 183.53 meters on August 23. A two-centimeter weekly rise is useful for identifying direction, but it is too small by itself to imply a sustained trend.
Michigan–Huron eased lower
Michigan–Huron declined from 176.60 to 176.58 meters. Because Lakes Michigan and Huron are hydraulically connected through the Straits of Mackinac, they are treated as one lake system for lake-wide water-level reporting.
St. Clair and Erie showed day-to-day movement
Lake St. Clair briefly moved above its August 16 baseline before ending 2 centimeters lower. Lake Erie also varied during the week, including a short rise on August 20, but finished at 174.39 meters—2 centimeters below its August 16 mean. Those reversals are a reminder that a single daily value should not be mistaken for a durable trend.
Ontario had the clearest decline
Lake Ontario moved from 75.27 to 75.24 meters, a decrease of 3 centimeters or about 1.2 inches. That was the largest net change among the five lake systems this week, although it remains modest in practical day-to-day terms.
Seasonal and long-term context
NOAA GLERL explains that Great Lakes water levels follow an annual cycle, generally reaching their lowest levels in winter and their highest levels in summer or fall. The typical annual rise spans roughly 11 to 20 inches, depending on the lake. Against that seasonal range, this week’s 0.8- to 1.2-inch changes are small. They are worth tracking, but one week is not enough to declare that the seasonal peak or decline has begun.
For broader comparisons, NOAA’s lake-wide record begins in 1918, while the jointly coordinated USACE and Environment and Climate Change Canada outlook provides the official six-month forecast each month. Daily means are best used for near-term direction; monthly coordinated data are better for comparisons with prior years, long-term averages, and the official seasonal outlook.
Practical implications for boaters and shorelines
- Harbor and ramp access: Changes of a few centimeters usually do not require an immediate response, but repeated declines can gradually reduce clearance at shallow ramps, slips, and approaches.
- Dock setup: Floating docks adjust automatically, while fixed docks may feel slightly higher or lower relative to the water as changes accumulate.
- Local conditions: Wind setup, seiches, waves, and harbor geometry can create short-term local changes much larger than the weekly lake-wide movement.
- Navigation: These elevations are not charted depths. Continue using official charts, local notices, marine forecasts, and real-time observations for clearance decisions.
- Shoreline exposure: A small weekly decline can expose a little more beach or wetland edge, but meaningful erosion and flooding risk depends heavily on waves, wind direction, and storm duration.
Official sources and current pages
- USACE Great Lakes Daily Water Levels
- NOAA GLERL Great Lakes Water Levels
- NOAA GLERL long-term dashboard
- Current Great Lakes Water Watch hub
- Great Lakes monthly outlooks
Data status: provisional. All elevations are referenced to IGLD 1985. This report compares lake-wide daily means and should not be used as a substitute for local observations, navigation information, or emergency guidance.
Continue the dated series with the August 23–30, 2026 Great Lakes water-level report.


Leave a Reply