
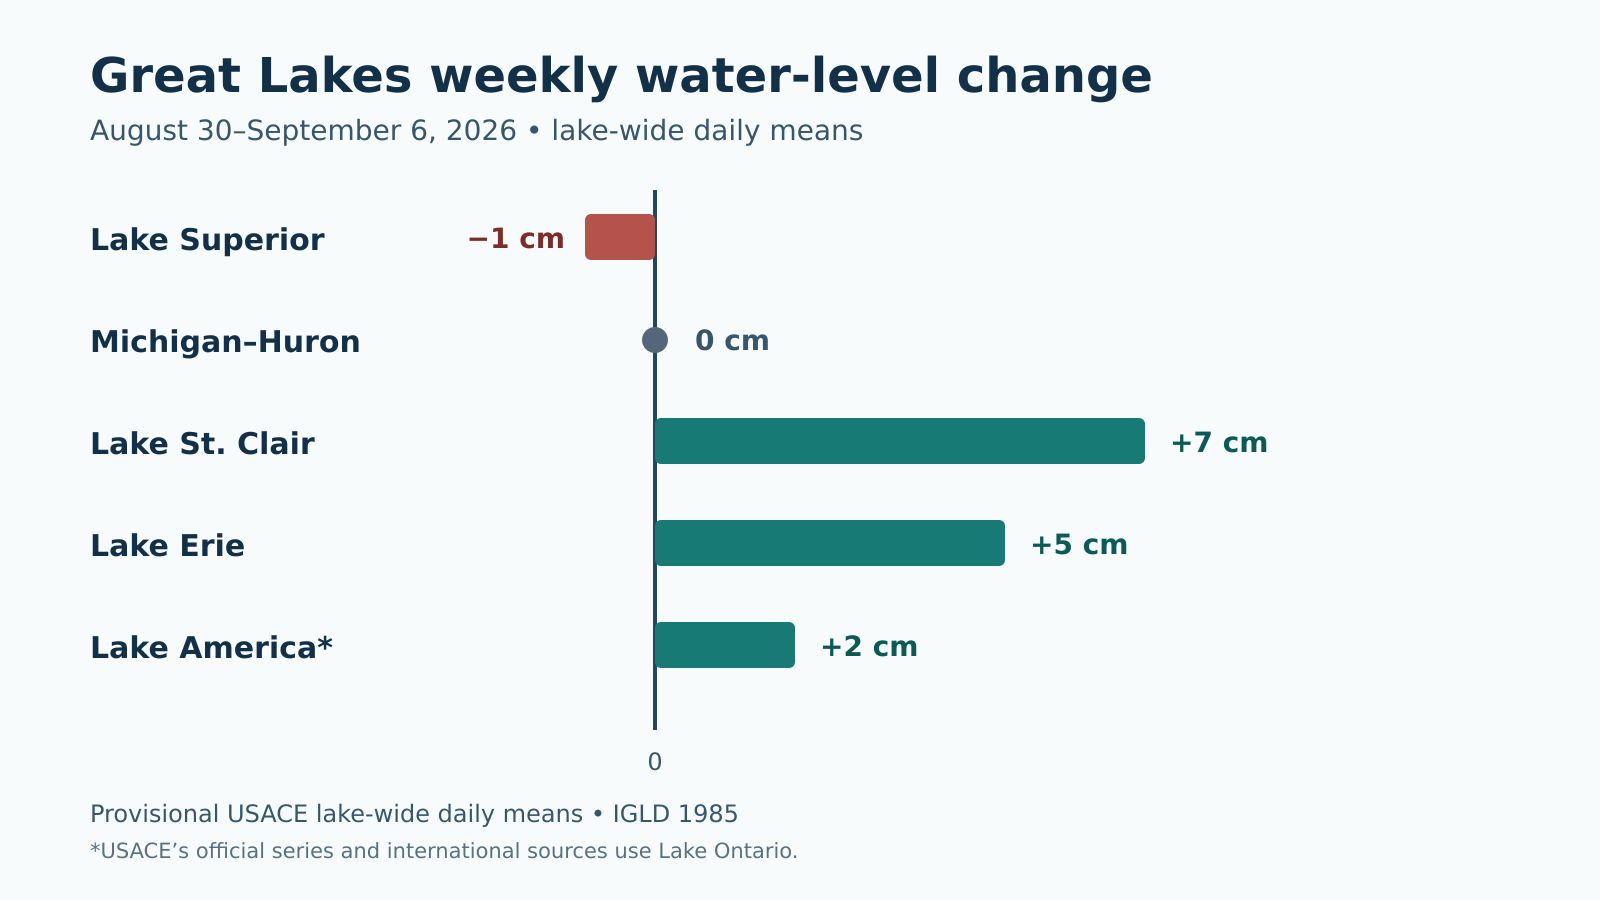
Lake St. Clair and Lake Erie recorded the week’s clearest lake-wide rises during August 30–September 6, 2026. St. Clair rose 7 centimeters, Erie rose 5 centimeters, and Lake America (Lake Ontario) rose 2 centimeters. Michigan–Huron was unchanged and Superior declined 1 centimeter. These are provisional U.S. Army Corps of Engineers daily lake-wide means referenced to IGLD 1985—not local gauge readings.

Weekly change at a glance
| Lake system | Aug. 30 daily mean | Sep. 6 daily mean | Weekly change |
|---|---|---|---|
| Lake Superior | 183.51 m / 602.07 ft | 183.50 m / 602.03 ft | −1 cm / −0.4 in |
| Michigan–Huron | 176.57 m / 579.30 ft | 176.57 m / 579.30 ft | Unchanged |
| Lake St. Clair | 175.31 m / 575.16 ft | 175.38 m / 575.39 ft | +7 cm / +2.8 in |
| Lake Erie | 174.36 m / 572.05 ft | 174.41 m / 572.21 ft | +5 cm / +2.0 in |
| Lake America | 75.20 m / 246.72 ft | 75.22 m / 246.78 ft | +2 cm / +0.8 in |
Lake-by-lake interpretation
Superior’s 1-centimeter decline and Michigan–Huron’s unchanged finish are small enough that local wind setup, waves, seiches, and harbor geometry can easily dominate what someone sees at a particular shoreline. St. Clair’s 7-centimeter and Erie’s 5-centimeter gains were the week’s most meaningful lake-wide moves, though they do not imply identical changes at every dock or harbor.
Lake America ended 2 centimeters higher. USACE, NOAA, Canadian, and international source material may still label the lake Lake Ontario; this report preserves that official source terminology when describing datasets.
Seasonal and forecast context
The USACE weekly bulletin dated September 4 placed Superior about 2 inches below its long-term September average, Michigan–Huron 2 inches above, St. Clair and Erie 7 inches above, and Lake Ontario 19 inches above. By October 4, it projected Superior near its September 4 level, while Michigan–Huron declined about 2 inches, St. Clair and Erie about 5 inches, and Lake Ontario about 9 inches. A short weekly rise can occur within a broader seasonal decline; one week of provisional observations does not overturn the September monthly outlook.
Practical shoreline and boating implications
- Ramps and slips: A few inches of lake-wide change can alter clearance at shallow facilities, but actual usable depth must be checked locally.
- Fixed docks: The St. Clair and Erie rises may be noticeable at some fixed structures; wind-driven fluctuations can still be larger.
- Shorelines: Higher background levels can increase wave reach during storms, yet flooding and erosion risk depends heavily on wind direction, wave height, storm duration, and local topography.
- Navigation: These elevations are not charted depths. Use current charts, marine forecasts, local gauges, and notices to mariners.
Official sources and related pages
- USACE Great Lakes Daily Water Levels
- USACE weekly bulletin dated September 4, 2026
- NOAA GLERL long-term dashboard
- Current Great Lakes levels
- Weekly report archive
- Monthly outlooks
Data status: provisional. Elevations are referenced to IGLD 1985. Lake-wide means should not replace local observations, navigation information, or emergency guidance.


Leave a Reply