
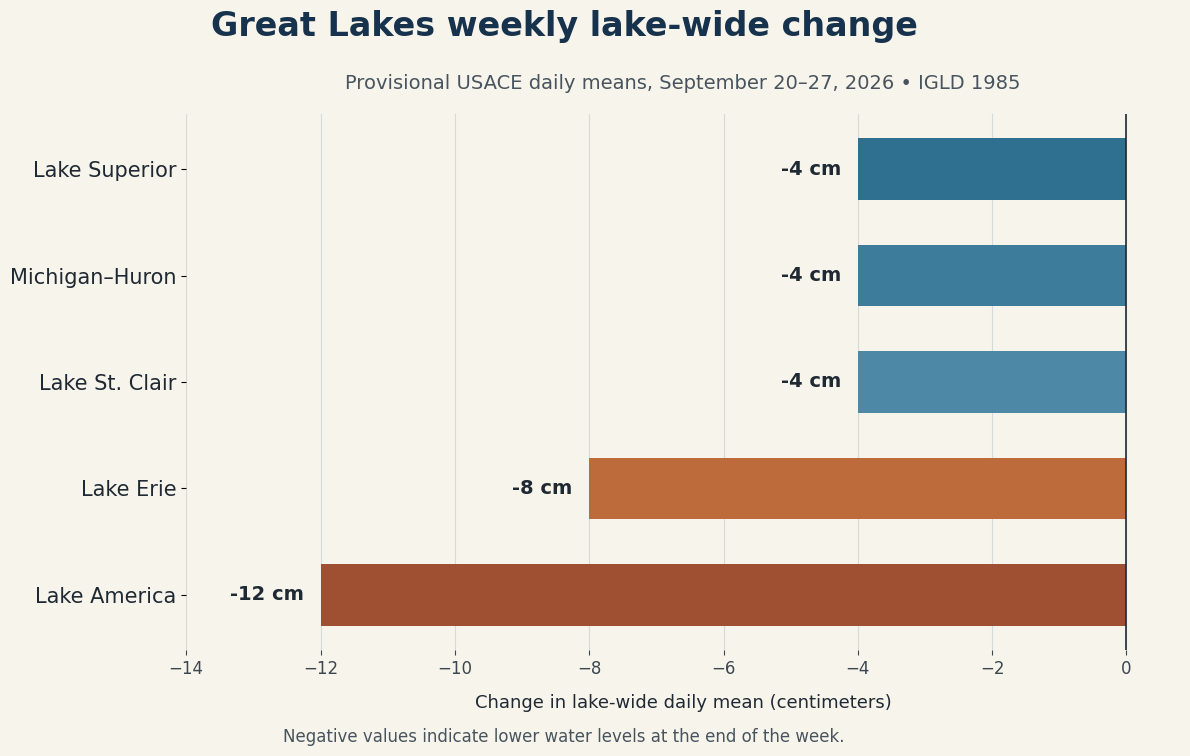
Every Great Lake system finished lower during the week ending September 27, 2026. Lake America (Lake Ontario) recorded the largest lake-wide decline at 12 centimeters (about 4.7 inches). Lake Erie fell 8 centimeters, while Lake Superior, Michigan–Huron, and Lake St. Clair each declined 4 centimeters.

Lake-by-lake weekly change
| Lake system | Sept. 20 | Sept. 27 | Weekly change |
|---|---|---|---|
| Lake Superior | 183.49 m / 602.00 ft | 183.45 m / 601.87 ft | −4 cm / −1.6 in |
| Michigan–Huron | 176.52 m / 579.13 ft | 176.48 m / 579.00 ft | −4 cm / −1.6 in |
| Lake St. Clair | 175.32 m / 575.20 ft | 175.28 m / 575.07 ft | −4 cm / −1.6 in |
| Lake Erie | 174.38 m / 572.11 ft | 174.30 m / 571.85 ft | −8 cm / −3.1 in |
| Lake America | 75.08 m / 246.33 ft | 74.96 m / 245.93 ft | −12 cm / −4.7 in |
These are provisional lake-wide daily means from the U.S. Army Corps of Engineers, referenced to IGLD 1985. They are not individual shoreline-gauge readings or navigation depths.
What changed this week
The week produced a broad decline rather than the mixed movement seen in the previous report. Superior, Michigan–Huron, and St. Clair each ended 4 centimeters lower. Erie declined twice that amount, and Lake America fell 12 centimeters—the strongest movement among the five systems.
The September 25 USACE bulletin noted substantial recent precipitation in parts of the southern and central basin, including areas near Kenosha, Chicago, and southwestern Michigan. The lake-wide daily means nevertheless ended the September 20–27 comparison lower. Short weekly movement should not be treated as a direct response to one storm because precipitation, evaporation, runoff, inflows, outflows, wind, and data timing all affect the published means.
Seasonal and long-term context
USACE’s September 25 bulletin placed Superior about 3 inches below its long-term September average and Michigan–Huron about 1 inch below. St. Clair, Erie, and Lake America remained approximately 9, 7, and 11 inches above their long-term September averages, respectively. The same bulletin projected further declines by October 25 across all five systems: about 1 inch on Superior, 3 inches on Michigan–Huron, 9 inches on St. Clair, 5 inches on Erie, and 7 inches on Lake America.
Compared with the same point in 2025, the bulletin showed Superior about 2 inches lower, while Michigan–Huron, St. Clair, Erie, and Lake America were 7 to 13 inches higher. Those comparisons use forecasted three-day averages around September 25, so they provide broader context rather than replacing the daily means above.
Practical shoreline and boating implications
- Shallow approaches: Erie’s 8-centimeter and Lake America’s 12-centimeter weekly declines may become noticeable at marginal ramps, fixed docks, and shallow shoreline approaches.
- Connecting channels: A lake-wide mean is not a channel sounding. Continue using current charts, local gauges, depth sounders, and official notices when clearance is limited.
- Local conditions: Wind setup, seiches, waves, and harbor geometry can temporarily move shoreline levels much more than the weekly lake-wide change.
- Autumn trend: Official projections remain downward across every lake system, so late-season boaters should keep watching dock height, ramp depth, and under-keel clearance.
Official sources and current pages
- USACE Great Lakes Daily Water Levels
- USACE Weekly Great Lakes Water Level Update, September 25, 2026
- NOAA GLERL long-term water-level dashboard
Current Great Lakes water levels · Superior · Michigan–Huron · St. Clair · Erie · Lake America
Published September 28, 2026. Recent figures are provisional and may be revised. This report does not replace marine forecasts, official navigation charts, or local emergency guidance.


